


Blu-ray and DVD sales - We're number 2, but we try harder
 06-13-19, 08:44 PM
#5476
DVD Talk Hero
Re: Blu-ray and DVD sales - We're number 2, but we try harder
It's really time to put DVD out to pasture- they did it with VHS already.
The only way niche media like BD and UHD would even be the norm is that if they did put DVD to pasture and price them like DVDs are now, but then what's the studios' motivation for doing that? They want to make money and they're not about to start dropping prices on that anytime soon.
 06-14-19, 09:41 AM
#5477
DVD Talk Legend
Re: Blu-ray and DVD sales - We're number 2, but we try harder
What would that accomplish at this point? Physical media sales as a whole are rapidly declining. DVD and Blu-ray are no longer competitors to each other. They're both fighting together against streaming.
06-14-19, 09:51 AM
#5478
DVD Talk Ultimate Edition
Re: Blu-ray and DVD sales - We're number 2, but we try harder
 06-14-19, 10:03 AM
#5479
DVD Talk Ultimate Edition
Re: Blu-ray and DVD sales - We're number 2, but we try harder
(As a hypothetical experiment).
If our esteemed AlanSmithee is more ambitious than he/she appears to be on here, then he/she would be striving to get a job as head of the home video division at a movie company which regularly releases stuff on dvd/bluray/4Kbluray.
If the big 5/6 movie companies won't hire him/her, then he/she will have to settle for working at a smaller company like Mill Creek or Echo Bridge.
Once AlanSmithee becomes head of the division at Mill Creek or Echo Bridge which makes the decisions of which titles to release, then we can do a countdown of how soon they will file for bankruptcy after Mill Creek or Echo Bridge starts to release everything as bluray-only (or 4Kbluray) with no dvd version.
Last edited by morriscroy; 06-14-19 at 10:42 AM.
06-14-19, 10:08 AM
#5480
DVD Talk Reviewer/ Admin
Join Date: Sep 1999
Location: Greenville, South Cackalack
Posts: 28,823
Received 1,882 Likes
on
1,238 Posts
Re: Blu-ray and DVD sales - We're number 2, but we try harder
How could you make a mock-Alan-Smithee post without a single reference to 3D?!?! 
 06-14-19, 10:44 AM
#5481
DVD Talk Ultimate Edition
Re: Blu-ray and DVD sales - We're number 2, but we try harder
06-14-19, 11:18 AM
#5482
DVD Talk Legend
Re: Blu-ray and DVD sales - We're number 2, but we try harder
The image of theater audiences wearing cardboard red/blue glasses is mostly a myth. Even in the 1950s, 3D movies used glasses with polarized lenses similar to what you get in a RealD or IMAX 3D theater now.
06-16-19, 01:37 AM
#5483
DVD Talk Reviewer & TOAT Winner
Re: Blu-ray and DVD sales - We're number 2, but we try harder
What would that accomplish at this point? Physical media sales as a whole are rapidly declining. DVD and Blu-ray are no longer competitors to each other. They're both fighting together against streaming.
Once AlanSmithee becomes head of the division at Mill Creek or Echo Bridge which makes the decisions of which titles to release, then we can do a countdown of how soon they will file for bankruptcy after Mill Creek or Echo Bridge starts to release everything as bluray-only (or 4Kbluray) with no dvd version.
And what about Shout Factory? I've bought more from them lately than any other label- but they don't bother with DVD at all for most of their releases. Old movies like Great Waldo Pepper, Can't Stop the Music, Going My Way, etc- all listed on their website as Blu-Ray only with NO DVD option at all. Seems like if you even remember most of those titles, you've already got them on an older format and would only buy them in hi-def if you were to spend any more money on them. It'll certainly suck when they go bankrupt, ditto for Arrow (though they've included DVDs with a few of their titles, none by themselves though. And yes, these companies should be releasing at least some of these on 4K, but that'll have to be another discussion.)
Blu-Rays don't even typically COST a lot more than DVDs anymore- they might have when they launched, with players in the over $700 range and movies around $30 each, but that's all changed now. Often at Target, I see the same titles priced either the same or sometimes even LESS than the DVD, even when the Blu-Ray INCLUDES a DVD with it. (I reviewed the sequel to "Happy Death Day" here this week, having watched a digital copy of the first movie that I'd been given. I decided to buy the first movie on Blu-Ray afterwards; I would've bought it on 4K but it's not available in that format. I searched a number of Target stores in the area for it- one store had only the DVD for $7 so of course I passed on that, I found the Blu-Ray at another location for $10 and that included the DVD with it, plus another digital copy which I can give away.) 4K discs are still pricey for the most part, shelf space could be saved by marketing those to the 'enthusiasts' and a Blu-Ray/DVD set to everyone else, if DVD even needs to stay around at all.
06-16-19, 02:28 PM
#5484
DVD Talk Legend
Re: Blu-ray and DVD sales - We're number 2, but we try harder
Streaming offers great quality, a huge convenience and an overall cheaper price.
For the most part, people don't want to own their movies... they want to watch it and move on with their lives.
What does it cost someone monthly to stream via a service like Netflix? $12? That gets you the ability to play a shit-ton of movies and shows. Sure you will have to wait a little longer to watch a movie that was just released on BD - but there's plenty to watch in the meantime. And that monthly price is cheaper than a single movie on BD - a movie they may find they didn't like, or do like but never watch again as it sits on the shelf collecting dust.
Physical media is becoming an increasingly smaller niche every year. That won't stop. Better get used to it.
06-16-19, 03:59 PM
#5485
DVD Talk Hero
Re: Blu-ray and DVD sales - We're number 2, but we try harder
Physical media is becoming an increasingly smaller niche every year. That won't stop. Better get used to it.
06-17-19, 03:19 PM
#5486
DVD Talk Hero
Re: Blu-ray and DVD sales - We're number 2, but we try harder
The real problem for media collectors is that we've skimmed off media for years as a huge mass market and reaped those benefits. We are going back to the days of laserdisc-like pricing and limited availability for most media items. Collector pricing provides far less value and items often become rare due to misjudged demand.
06-18-19, 11:26 AM
#5487
DVD Talk Limited Edition
Re: Blu-ray and DVD sales - We're number 2, but we try harder
The real problem for media collectors is that we've skimmed off media for years as a huge mass market and reaped those benefits. We are going back to the days of laserdisc-like pricing and limited availability for most media items. Collector pricing provides far less value and items often become rare due to misjudged demand.
06-18-19, 02:26 PM
#5488
DVD Talk Special Edition
Re: Blu-ray and DVD sales - We're number 2, but we try harder
The real problem for media collectors is that we've skimmed off media for years as a huge mass market and reaped those benefits. We are going back to the days of laserdisc-like pricing and limited availability for most media items. Collector pricing provides far less value and items often become rare due to misjudged demand.
06-22-19, 07:52 PM
#5489
DVD Talk Reviewer & TOAT Winner
Re: Blu-ray and DVD sales - We're number 2, but we try harder
Incidentally I was at a Walmart this week and looked at their disc players just for fun. They had 5 models all priced under $100, only two of them were DVD-only and one was REALLY cheap, $25, less than what many early DVD discs retailed for. They also had one player above $100 which played 4K discs. They still had a higher proportion of material for sale on DVD than Blu-Ray or 4K.
No Kino or Olive discs there of course, but most of those type of releases, remasters
of older movies, retailed for $40-50 on laserdisc. Thankfully the highest I�ve seen those labels sell for is $30.
No Kino or Olive discs there of course, but most of those type of releases, remasters
of older movies, retailed for $40-50 on laserdisc. Thankfully the highest I�ve seen those labels sell for is $30.
06-24-19, 08:38 AM
#5490
Political Exile
Re: Blu-ray and DVD sales - We're number 2, but we try harder
I bought my mom a LG UP870 4K Player from Walmart early last year for $79. It was around that price for quite some time. Surprised to see that they don't have another inexpensive player to replace that model.
06-24-19, 06:34 PM
#5491
Re: Blu-ray and DVD sales - We're number 2, but we try harder
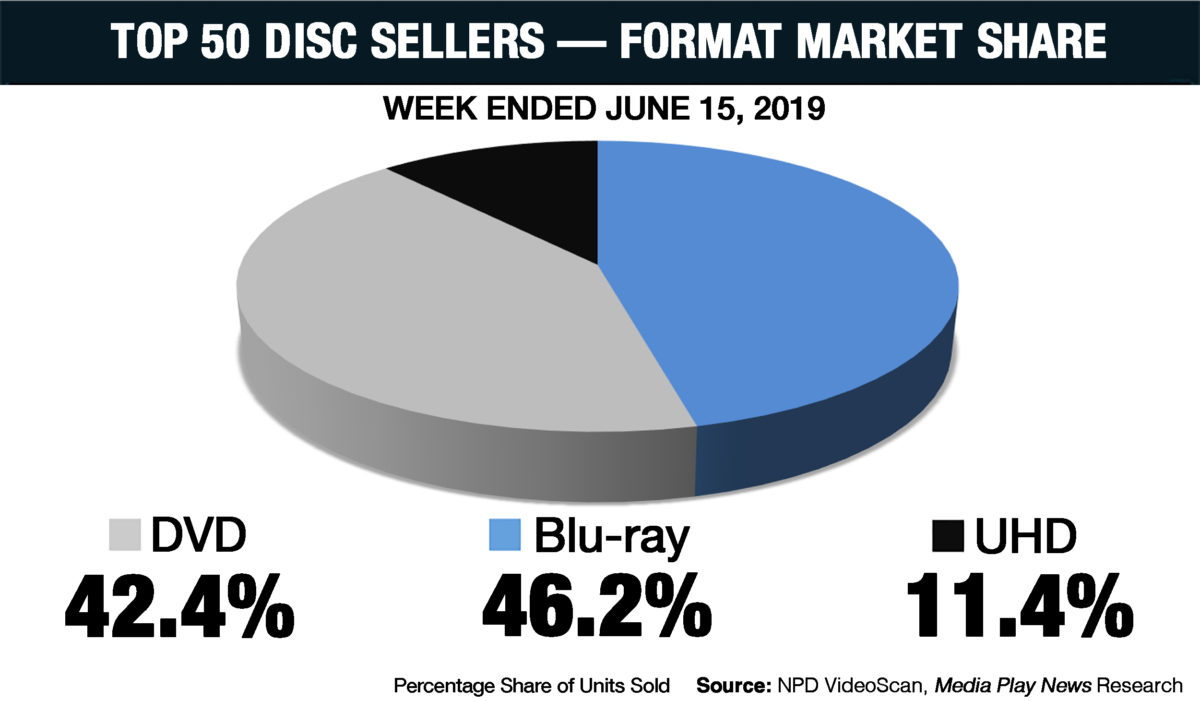
Captain Marvel boosted UHD sales last week. It's likely the week of June 15 will be the first up week this year since the week of April 13.
There have only been 3 overall up weeks for physical media so far this year: February 16 (Bohemian Rhapsody), April 6 (Bumblebee), April 13 (Glass). Not great.
There have only been 3 overall up weeks for physical media so far this year: February 16 (Bohemian Rhapsody), April 6 (Bumblebee), April 13 (Glass). Not great.
Last edited by WeeBey; 06-24-19 at 06:44 PM.
06-25-19, 08:04 AM
#5492
DVD Talk Platinum Edition
Re: Blu-ray and DVD sales - We're number 2, but we try harder
This has probably been asked before, but if a UHD comes with a BD, or a BD comes with a DVD, does it get counted as a sale for each format, or just for the most premium format?
06-25-19, 04:54 PM
#5494
DVD Talk Special Edition
Re: Blu-ray and DVD sales - We're number 2, but we try harder
06-25-19, 04:57 PM
#5495
DVD Talk Special Edition
Re: Blu-ray and DVD sales - We're number 2, but we try harder
So far this year:
OD: -20.4%
DVD: -23.6%
Blu-ray/UHD: -16.6% , 46.9% share
OD: -20.4%
DVD: -23.6%
Blu-ray/UHD: -16.6% , 46.9% share
Last edited by bruceames; 06-25-19 at 09:21 PM.
06-25-19, 11:09 PM
#5496
DVD Talk Special Edition
Re: Blu-ray and DVD sales - We're number 2, but we try harder
Updated thru week ending 6/15/19
Table of Blu-ray sales (MPN and DEG)
numbers are in (revenue) millions.
Weekly figures are from MPN (Media Play News)
Table of Blu-ray sales (MPN and DEG)
numbers are in (revenue) millions.
Weekly figures are from MPN (Media Play News)
Code:
Week Date OD OD YoY DVD DVD YoY BD BD YoY BD Share TBO2018 TBO2017 2019 MPN 1481.92 -20.4% 786.23 -23.6% 695.72 -16.6% 46.9% 4663.1 5867.0 Q2 MPN 617.47 -19.8% 328.00 -20.5% 289.48 -18.9% 46.9% 1822.4 2053.6 24 6/15 72.22 -4.8% 34.23 -16.0% 37.99 8.3% 53.0 % 484.6 251.0 23 6/8 48.79 -22.1% 27.94 -17.1% 20.85 -28.0% 42.7 % 95.3 156.1 22 6/1 46.37 -21.0% 26.42 -22.1% 19.95 -19.4% 43.0 % 11.6 32.7 21 5/25 65.17 -19.9% 34.80 -21.8% 30.37 -17.5% 46.6 % 164.2 457.7 20 5/18 45.34 -51.0% 25.86 -38.0% 19.47 -61.6% 43.0 % 94.4 705.0 19 5/11 50.19 -28.7% 27.75 -28.0% 22.45 -29.5% 44.7 % 178.9 103.7 18 5/4 46.83 -29.9% 26.92 -29.4% 19.91 -30.6% 42.5 % 26.2 191.0 17 4/27 45.27 -26.8% 25.62 -27.5% 19.65 -25.9% 43.4 % 59.6 192.1 16 4/20 74.82 16.9% 39.02 4.2% 35.81 34.9% 47.9 % 163.8 120.5 15 4/13 59.40 -24.9% 26.35 -27.9% 33.05 -22.3% 55.6 % 109.3 274.2 14 4/6 74.48 2.7% 39.21 -5.9% 35.27 14.4% 47.4 % 280.0 88.8 Q1 MPN 864.45 -20.9% 458.23 -25.6% 406.24 -14.9% 47.0% 2840.8 3587.4 13 3/30 71.52 -3.4% 38.72 -21.4% 32.80 32.6% 45.9 % 274.5 158.5 12 3/23 79.19 -25.7% 36.58 -36.1% 42.61 -13.5% 53.8 % 363.1 534.1 11 3/16 76.40 -32.9% 38.80 -29.9% 37.59 -35.8% 49.2 % 260.7 446.6 10 3/9 72.72 -35.4% 40.74 -25.1% 31.98 -45.1% 44.0 % 240.4 373.1 9 3/2 86.06 -17.0% 42.96 -22.4% 43.10 -10.9% 50.1 % 232.8 436.9 8 2/23 71.52 -3.4% 38.72 -21.4% 32.80 32.6% 45.9 % 274.5 158.5 7 2/16 74.29 5.0% 39.05 -15.0% 35.25 42.0% 47.4 % 254.1 147.2 6 2/9 59.51 -4.2% 33.92 -18.2% 25.59 23.9% 43.0 % 338.0 102.0 5 2/2 51.42 -8.7% 29.12 -23.3% 22.30 21.4% 43.4 % 92.5 51.9 4 1/26 48.46 -17.9% 27.20 -24.5% 21.26 -7.5% 43.9 % 79.7 86.0 3 1/19 52.37 -18.3% 29.04 -23.7% 23.34 -10.4% 44.6 % 179.4 161.4 2 1/12 48.43 -29.9% 28.28 -31.4% 20.15 -27.6% 41.6 % 20.8 398.5 1 1/5 60.80 -2.0% 34.14 -15.0% 26.67 21.7% 43.9 % 102.6 71.0 2018 MPN 4108.60 -12.9% 2245.69 -20.7% 1862.99 -1.2% 45.3% 12132.1 10520.1 Q4 MPN 1262.03 -11.7% 684.77 -21.9% 577.28 4.6% 45.7% 3147.9 2504.6 52 12/29 90.76 11.5% 48.12 -4.2% 42.64 36.8% 47.0 % 24.1 49.6 51 12/22 163.61 -16.8% 84.22 -29.9% 79.39 3.9% 48.5 % 396.6 293.4 50 12/15 117.07 -20.7% 65.94 -27.8% 51.13 9.3% 43.7 % 260.2 154.9 49 12/8 98.15 -17.4% 55.78 -25.7% 42.37 -3.2% 43.2 % 386.6 303.9 48 12/1 104.65 -17.5% 57.80 -26.6% 46.85 -2.6% 44.8 % 26.7 31.3 47 11/24 220.82 -9.1% 116.45 -20.8% 104.37 8.9% 47.3 % 194.0 153.6 46 11/17 71.95 -0.8% 39.82 -15.4% 32.13 26.1% 44.7 % 221.4 117.7 45 11/10 79.76 -1.1% 38.41 -18.4% 41.36 23.1% 51.8 % 760.6 181.1 44 11/3 61.85 -10.7% 34.18 -24.6% 27.67 15.7% 44.7 % 114.0 81.6 43 10/27 57.62 -20.1% 33.58 -24.6% 24.04 -12.9% 41.7 % 138.2 340.1 42 10/20 68.98 -11.3% 37.29 -14.6% 31.69 -7.0% 45.9 % 230.3 452.7 41 10/13 66.10 -1.4% 37.85 -9.5% 28.26 22.4% 42.7 % 256.7 164.6 40 10/6 60.71 -21.3% 35.33 -20.5% 25.38 -22.4% 41.8 % 138.7 180.2 Q3 MPN 866.37 -11.1% 459.31 -20.6% 407.08 2.8% 47.0% 2982.6 2487.8 39 9/29 71.25 -4.1% 35.70 -16.7% 35.55 13.2% 49.9 % 261.9 176.3 38 9/22 69.33 -21.8% 36.66 -19.4% 32.67 -24.4% 47.1 % 417.2 461.0 37 9/15 53.02 -20.8% 32.71 -22.3% 20.31 -18.3% 38.3 % 160.3 176.9 36 9/8 57.96 -13.5% 34.43 -19.7% 23.53 -2.4% 40.6 % 99.1 94.6 35 9/1 64.90 -15.9% 36.03 -18.9% 28.87 -11.9% 44.5 % 152.1 74.9 34 8/25 82.04 -8.8% 37.00 -17.5% 45.05 0.2% 54.9 % 350.5 389.8 33 8/18 93.35 34.5% 38.37 -12.8% 54.99 116.4% 58.9 % 682.7 157.8 32 8/11 57.57 -12.3% 31.25 -27.4% 26.32 16.6% 45.7 % 102.9 109.0 31 8/4 59.94 -12.8% 34.73 -22.2% 25.21 4.7% 42.1 % 70.6 79.3 30 7/28 62.39 -17.5% 33.19 -26.5% 29.20 -4.2% 46.8 % 138.8 252.3 29 7/21 78.20 0.2% 39.76 -13.8% 38.44 20.5% 49.2 % 266.6 178.7 28 7/14 56.80 -35.5% 33.77 -32.0% 23.03 -40.1% 40.5 % 209.8 289.2 27 7/7 59.62 -8.3% 35.71 -17.7% 23.91 10.4% 40.1 % 70.2 18.0 Q2 MPN 891.42 -20.6% 489.53 -23.1% 401.90 -17.2% 45.1% 2420.5 3048.0 26 6/30 59.30 -17.2% 35.52 -21.0% 23.78 -10.7% 40.1 % 44.3 117.6 25 6/23 65.01 -14.7% 36.87 -21.5% 28.13 -3.8% 43.3 % 102.6 33.4 24 6/16 75.55 -28.3% 40.59 -26.3% 34.97 -30.5% 46.3 % 250.1 276.2 23 6/9 62.28 -42.6% 33.59 -35.7% 28.70 -49.0% 46.1 % 155.3 521.3 22 6/2 58.48 -19.5% 33.78 -25.2% 24.71 -10.0% 42.2 % 32.7 106.2 21 5/26 65.17 -19.9% 34.80 -21.8% 30.37 -17.5% 46.6 % 164.2 457.7 20 5/19 92.29 36.4% 41.58 0.9% 50.71 91.8% 54.9 % 703.7 79.7 19 5/12 70.17 -8.5% 38.37 -18.3% 31.80 7.0% 45.3 % 103.7 115.1 18 5/5 66.66 -6.5% 37.99 -16.9% 28.67 12.0% 43.0 % 190.2 114.5 17 4/28 61.67 -17.5% 35.19 -20.2% 26.47 -13.6% 42.9 % 191.6 181.6 16 4/21 63.67 -10.2% 37.29 -14.1% 26.39 -4.0% 41.4 % 120.5 171.9 15 4/14 78.87 -33.0% 42.39 -36.4% 36.47 -28.5% 46.2 % 273.2 283.3 14 4/7 72.30 -43.3% 41.57 -30.4% 30.73 -54.6% 42.5 % 88.4 589.6 Q1 MPN 1088.78 -8.7% 612.08 -17.2% 476.73 5.2% 43.8% 3581.1 2509.6 13 3/31 138.87 22.9% 63.50 4.8% 75.37 43.8% 54.3 % 620.3 344.2 12 3/24 105.79 2.6% 56.99 -4.5% 48.81 12.3% 46.1 % 532.4 340.7 11 3/17 113.04 14.9% 54.97 -11.8% 58.07 61.2% 51.4 % 445.2 191.4 10 3/10 111.47 -8.4% 54.01 -20.0% 57.46 6.1% 51.5 % 373.0 268.5 9 3/3 102.82 -4.7% 55.08 -13.7% 47.74 8.4% 46.4 % 434.6 311.2 8 2/24 73.91 -20.6% 48.85 -21.2% 25.06 -19.4% 33.9 % 158.4 143.5 7 2/17 70.73 -20.9% 45.34 -22.0% 25.40 -18.7% 32.7 % 51.8 159.2 6 2/10 61.97 -33.1% 40.53 -31.0% 21.44 -36.8% 34.6 % 102.0 210.8 5 2/3 56.29 -28.2% 37.88 -26.7% 18.41 -31.2% 32.7 % 51.8 159.2 4 1/27 58.95 -19.3% 35.92 -24.6% 23.04 -9.2% 39.1 % 86.0 52.0 3 1/20 64.03 -7.6% 37.97 -18.1% 26.06 13.5% 40.7 % 161.2 127.6 2 1/13 68.98 -8.8% 41.08 -16.2% 27.90 4.7% 40.4 % 398.5 191.3 1 1/6 61.93 -19.8% 39.96 -23.4% 21.97 -12.4% 35.5 % 71.1 45.6 2017 HMM 4709.40 -13.4% 2821.76 -17.3% 1887.65 -6.8% 40.1% 10508.2 11900.9 Q4 HMM 1423.53 -22.4% 867.51 -23.1% 556.04 -21.3% 39.1% 2496.8 3568.0 52 12/30 81.24 -13.3% 49.95 -15.0% 31.29 -10.3% 38.5 % 49.6 69.1 51 12/23 193.26 -31.2% 117.63 -31.0% 75.63 -31.5% 39.1 % 292.0 299.4 50 12/16 147.11 -32.3% 90.63 -28.4% 56.48 -37.8% 38.4 % 154.9 502.9 49 12/9 118.29 -33.8% 74.56 -30.4% 43.73 -38.8% 37.0 % 303.9 539.1 48 12/2 126.21 -21.2% 78.17 -21.3% 48.04 -21.0% 38.1 % 31.3 233.8 47 11/25 242.10 -13.0% 144.88 -15.7% 97.22 -8.5% 40.2 % 149.9 144.0 46 11/18 72.18 -37.2% 46.53 -27.9% 25.65 -49.1% 35.5 % 117.6 486.6 45 11/11 80.34 -2.3% 46.46 -16.1% 33.89 26.1% 42.2 % 181.1 101.2 44 11/4 68.91 -25.2% 44.56 -22.1% 24.35 -30.3% 35.3 % 81.6 295.6 43 10/28 72.23 0.5% 44.57 -11.7% 27.66 29.1% 38.3 % 339.8 113.9 42 10/21 77.71 -8.9% 43.48 -20.9% 34.23 12.7% 44.0 % 452.3 194.5 41 10/14 66.95 -27.0% 41.76 -27.4% 25.19 -26.4% 37.6 % 164.5 347.7 40 10/7 77.00 -11.6% 44.33 -16.7% 32.68 -3.6% 42.4 % 178.4 240.3 Q3 HMM 971.84 -8.5% 577.81 -15.1% 394.04 3.1% 40.5% 2461.3 2480.5 39 9/30 74.02 -10.5% 42.68 -15.5% 31.35 -2.7% 42.3 % 176.3 286.2 38 9/23 88.62 0.2% 45.32 -11.5% 43.29 16.2% 48.9 % 460.6 158.5 37 9/16 66.52 -34.1% 41.87 -25.9% 24.66 -44.5% 37.1 % 176.7 521.6 36 9/9 66.99 -16.8% 42.78 -21.2% 23.92 -7.6% 35.9 % 94.5 141.9 35 9/2 76.77 -11.5% 44.34 -21.4% 32.43 6.9% 42.2 % 74.9 420.6 34 8/26 89.64 19.2% 44.75 -13.5% 44.89 91.3% 50.1 % 389.7 102.5 33 8/19 69.55 -3.2% 43.98 -12.1% 25.57 17.3% 36.8 % 157.8 128.5 32 8/12 65.32 -0.7% 43.11 -10.1% 22.21 24.4% 34.0 % 108.9 4.2 31 8/5 68.55 -9.0% 44.70 -13.4% 23.85 0.5% 34.8 % 79.3 78.9 30 7/29 75.57 -2.3% 45.15 -10.5% 30.42 13.1% 40.3 % 252.1 145.4 29 7/22 77.90 -19.5% 46.10 -13.2% 31.79 -27.2% 40.8 % 183.8 345.7 28 7/15 87.91 2.1% 49.66 -10.9% 38.25 25.9% 43.5 % 288.9 140.2 27 7/8 64.78 -13.7% 43.37 -14.9% 21.41 -11.3% 33.1 % 17.9 6.4 Q2 HMM 1121.50 -4.9% 637.12 -10.1% 484.35 2.9% 43.2% 3044.2 2989.7 26 7/1 71.44 -9.1% 44.95 -16.4% 26.49 6.7% 37.1 % 117.6 185.8 25 6/24 76.11 -0.6% 46.93 -9.9% 29.18 19.3% 38.3 % 33.4 72.4 24 6/17 105.28 7.5% 55.01 -10.2% 50.27 37.0% 47.7 % 276.5 175.6 23 6/10 108.48 1.2% 52.23 -13.6% 56.26 20.4% 51.9 % 520.6 434.0 22 6/3 72.52 4.1% 45.41 -11.5% 27.10 11.7% 37.4 % 106.2 74.0 21 5/27 81.33 -11.5% 44.57 -9.5% 36.75 55.2% 45.2 % 456.6 140.1 20 5/20 67.70 -11.9% 41.29 -17.0% 26.41 -2.6% 39.0 % 79.7 61.1 19 5/13 76.67 -28.1% 47.03 -16.6% 29.64 -41.0% 38.7 % 115.0 403.7 18 5/6 71.29 -11.5% 45.76 -16.3% 25.33 -1.5% 35.8 % 114.3 112.8 17 4/29 74.86 -3.5% 44.17 -14.1% 30.68 17.4% 41.0 % 181.6 140.5 16 4/22 70.83 -15.1% 43.41 -16.9% 27.41 -12.2% 38.7 % 171.8 225.2 15 4/15 117.63 32.1% 66.62 26.7% 51.01 40.9% 43.4 % 281.6 26.6 14 4/8 127.36 -18.9% 59.74 -6.2% 67.62 -27.6% 53.1 % 589.4 938.0 Q1 HMM 1192.53 -12.3% 739.32 -17.4% 453.22 -2.5% 38.0% 2505.9 2862.7 13 4/1 112.95 24.4% 60.55 -0.2% 52.40 73.8% 46.4 % 344.2 118.2 12 3/25 103.13 -28.7% 59.67 -35.5% 43.46 -16.7% 42.1 % 340.2 433.9 11 3/18 98.33 -12.1% 62.34 -17.5% 35.99 -0.9% 36.6 % 191.2 295.0 10 3/11 121.64 23.2% 67.49 -0.4% 54.15 74.6% 44.5 % 267.7 162.7 9 3/4 107.76 6.5% 63.76 -7.5% 44.00 36.5% 40.8 % 310.3 184.5 8 2/25 93.03 -12.0% 61.94 -12.3% 31.09 -11.3% 33.4 % 143.1 190.7 7 2/18 89.28 -8.3% 58.05 -14.9% 31.23 7.3% 35.0 % 123.5 101.2 6 2/11 92.58 -23.3% 58.63 -25.2% 33.95 -19.8% 36.7 % 210.1 266.0 5 2/4 78.85 -22.1% 51.94 -20.0% 26.91 -25.8% 34.1 % 159.2 123.2 4 1/28 72.94 -25.9% 47.60 -27.1% 25.34 -23.5% 34.7 % 52.1 97.3 3 1/21 69.27 -31.1% 46.31 -26.5% 22.97 -38.9% 33.2 % 127.6 302.3 2 1/14 75.60 -24.5% 48.94 -19.9% 26.66 -31.6% 35.3 % 191.3 449.5 1 1/7 77.17 -12.5% 52.10 -9.6% 25.07 -18.0% 32.5 % 45.6 138.3 2016 HMM 5453.79 -9.0% 3430.39 -13.5% 2023.41 -0.5% 37.1% 11887.0 10533.0 Q4 HMM 1846.85 -13.1% 1136.34 -13.3% 710.53 -12.9% 38.5% 3565.4 3309.2 52 12/31 94.19 -23.2% 59.19 -22.3% 35.01 -24.7% 37.2 % 69.0 109.1 51 12/24 282.55 1.6% 171.74 1.2% 110.81 2.1% 39.2 % 298.5 105.5 50 12/17 218.73 -17.6% 127.64 -19.2% 91.09 -15.3% 41.6 % 502.4 417.4 49 12/10 179.82 -17.0% 108.07 -14.0% 71.75 -21.2% 39.9 % 538.7 532.3 48 12/3 161.58 -3.7% 100.45 -8.4% 61.13 5.1% 37.8 % 233.7 19.6 47 11/2 280.33 -4.3% 173.78 -9.5% 106.55 5.5% 38.0 % 144.0 87.9 46 11/19 116.00 13.5% 65.09 -3.3% 50.91 45.8% 43.9 % 486.6 52.6 45 11/12 82.80 -24.8% 55.69 -20.7% 27.11 -31.9% 32.7 % 101.2 230.8 44 11/5 92.68 -27.5% 57.51 -25.7% 35.18 -30.3% 38.0 % 295.6 420.1 43 10/29 72.35 -29.5% 50.73 -22.6% 21.62 -41.6% 29.9 % 113.6 217.9 42 10/22 85.81 -35.3% 55.20 -19.1% 30.61 -52.4% 35.7 % 194.6 697.4 41 10/15 92.22 -13.7% 57.73 -9.6% 34.49 -19.8% 37.4 % 347.6 290.2 40 10/8 87.79 -11.6% 53.52 -19.2% 34.27 3.8% 39.0 % 240.2 128.4 Q3 HMM 1062.92 -7.8% 680.69 -14.7% 382.21 7.6% 36.0% 2480.1 2303.8 39 10/1 83.38 -28.0% 50.61 -29.4% 32.77 -25.8% 39.3 % 286.0 650.0 38 9/24 88.47 -6.9% 50.51 -18.8% 37.95 15.6% 42.9 % 158.3 185.3 37 9/17 100.88 -18.7% 56.65 -18.7% 44.22 -12.9% 43.8 % 521.4 584.4 36 9/10 80.07 0.1% 54.37 -7.1% 25.70 19.6% 32.1 % 141.9 43.9 35 9/3 86.79 -2.0% 56.56 -7.8% 30.23 11.0% 34.8 % 420.5 163.8 34 8/27 75.45 3.0% 51.95 -5.7% 23.50 29.4% 31.1 % 103.0 27.9 33 8/20 71.78 -5.7% 50.09 -12.0% 21.69 13.2% 30.2 % 128.5 7.8 32 8/13 65.55 -16.8% 47.80 -18.8% 17.75 -10.8% 27.1 % 4.2 67.2 31 8/6 75.00 -18.8% 51.34 -20.4% 23.66 -15.1% 31.5 % 78.9 166.8 30 7/30 77.19 -11.2% 50.45 -16.7% 26.74 1.3% 34.6 % 145.1 182.1 29 7/23 96.62 25.8% 53.10 -5.4% 43.52 110.3% 45.0 % 345.7 3.7 28 7/16 85.82 -6.5% 55.62 -12.8% 30.20 8.0% 35.2 % 140.2 185.9 27 7/9 75.92 -1.5% 51.64 -11.5% 24.28 29.7% 32.0 % 6.4 35.1 Q2 HMM 1188.41 4.3% 716.43 -9.5% 471.98 35.9% 39.7% 2985.4 1764.1 26 7/2 79.30 -1.7% 54.21 -10.4% 25.08 24.6% 31.6 % 185.8 115.1 25 6/25 77.13 0.6% 52.63 -6.9% 24.50 21.5% 31.8 % 72.4 0.1 24 6/18 98.65 1.9% 61.90 -4.9% 36.75 15.7% 37.3 % 175.5 100.5 23 6/11 107.74 19.3% 60.99 -1.2% 46.75 63.7% 43.4 % 431.8 185.5 22 6/4 76.29 -22.2% 51.94 -20.9% 24.35 -24.7% 31.9 % 73.8 309.0 21 5/28 73.60 -12.0% 49.82 -14.9% 23.78 -5.1% 32.3 % 140.1 23.6 20 5/21 77.54 -26.5% 50.34 -25.8% 27.20 -27.9% 35.1 % 61.1 376.0 19 5/14 107.18 23.1% 56.93 -6.0% 50.25 89.4% 46.9 % 403.3 34.5 18 5/7 81.33 -19.5% 55.32 -17.3% 26.02 -23.7% 32.0 % 112.7 251.6 17 4/30 78.19 -1.6% 52.00 -9.3% 26.19 18.3% 33.5 % 140.1 23.6 16 4/23 84.07 4.5% 52.84 -8.3% 31.23 37.0% 37.1 % 224.9 91.7 15 4/16 89.59 17.2% 53.25 -2.1% 36.34 64.8% 40.6 % 26.6 43.1 14 4/9 157.80 90.2% 64.26 9.0% 93.54 289.4% 59.3 % 937.2 7.8 Q1 HMM 1355.61 -14.1% 896.93 -15.7% 458.69 -10.9% 33.8% 2856.1 3156.0 13 4/2 91.71 -39.0% 61.35 -38.2% 30.35 -40.5% 33.1 % 118.1 333.7 12 3/26 145.35 0.1% 93.05 2.4% 52.30 -3.8% 36.0 % 433.8 498.8 11 3/19 112.95 0.7% 76.44 -0.2% 36.52 2.7% 32.3 % 294.4 260.6 10 3/12 99.52 -16.8% 68.43 -15.6% 31.08 -19.3% 31.2 % 162.6 114.5 9 3/5 86.02 -38.5% 60.05 -34.3% 25.97 -46.3% 30.2 % 184.1 350.9 8 2/27 106.70 -29.5% 71.62 -24.7% 35.08 -37.7% 32.9 % 186.8 303.2 7 2/20 98.44 -18.9% 69.29 -15.6% 29.15 -25.9% 29.6 % 101.2 218.7 6 2/13 122.01 -5.6% 79.65 -12.7% 42.36 11.3% 34.7 % 265.7 126.4 5 2/6 102.48 -15.3% 66.32 -21.2% 36.17 -1.7% 35.3 % 123.0 182.6 4 1/30 99.47 -10.2% 66.32 -11.6% 33.15 -7.1% 33.3 % 97.3 192.7 3 1/23 101.43 1.1% 63.96 -7.1% 37.47 19.2% 36.9 % 302.3 273.7 2 1/16 100.71 12.1% 62.20 -4.4% 38.52 55.4% 38.2 % 448.4 201.4 1 1/9 88.82 0.9% 58.25 -8.5% 30.57 25.4% 34.4 % 138.3 98.7 2015 HMM 5982.0 -11.6% 3959.60 -14.9% 2022.43 -4.6% 33.8% 10548.9 10507.6 Q4 HMM 2120.41 -6.6% 1312.11 -14.9% 808.32 11.2% 38.1% 3308.0 3199.3 52 1/2 122.55 1.1% 76.23 -9.2% 46.32 24.1% 37.8 % 109.1 103.7 51 12/26 278.08 5.8% 170.80 -6.4% 107.28 33.3% 38.6 % 105.5 7.1 50 12/19 265.13 -13.5% 159.63 -22.9% 105.50 5.9% 39.8 % 417.3 343.8 49 12/12 215.99 -13.0% 128.33 -20.5% 87.66 1.0% 40.6 % 532.3 410.0 48 12/5 167.01 -17.8% 108.97 -21.9% 58.04 -8.9% 34.8 % 19.5 291.0 47 11/28 292.88 -11.2% 191.68 -15.3% 101.20 -2.3% 34.6 % 87.9 165.5 46 11/21 101.56 -21.3% 66.89 -26.6% 34.68 -8.4% 34.1 % 52.6 324.7 45 11/14 109.57 -20.8% 69.83 -22.8% 39.74 -17.1% 36.3 % 230.6 391.6 44 11/7 127.41 -1.2% 77.03 -7.4% 50.38 10.2% 39.5 % 419.7 408.6 43 10/31 101.99 14.7% 65.10 -2.2% 36.90 65.0% 36.2 % 217.9 65.1 42 10/24 132.34 41.4% 68.00 1.9% 64.34 139.6% 48.6 % 697.0 157.5 41 10/17 106.67 -5.0% 63.65 -12.6% 43.02 9.2% 40.3 % 290.2 347.5 40 10/10 99.23 -6.7% 65.97 -7.0% 33.26 -6.2% 33.5 % 128.4 183.4 Q3 HMM 1147.35 -13.2% 793.83 -15.3% 353.52 -8.1% 30.8% 2299.4 2295.6 39 10/3 115.56 1.4% 71.34 -3.4% 44.22 10.3% 38.3 % 650.1 278.5 38 9/26 94.73 -2.5% 61.87 -11.4% 32.86 20.1% 34.7 % 184.7 156.0 37 9/19 120.04 -0.2% 69.38 -14.0% 50.66 28.0% 42.2 % 582.4 391.7 36 9/12 79.80 -28.5% 58.35 -20.4% 21.45 -44.0% 26.9 % 43.9 285.5 35 9/5 88.23 -0.7% 61.12 -10.2% 27.11 30.7% 30.7 % 163.6 40.0 34 8/29 73.03 -25.3% 54.90 -23.7% 18.12 -29.9% 24.8 % 27.8 66.3 33 8/22 75.79 -26.7% 56.68 -20.0% 19.12 -41.2% 25.2 % 7.8 217.1 32 8/15 78.42 -21.4% 58.56 -19.0% 19.85 -27.6% 25.3 % 67.1 93.1 31 8/8 92.02 -17.7% 64.19 -18.5% 27.83 -15.9% 30.2 % 166.8 283.1 30 8/1 86.59 -14.0% 60.24 -17.8% 26.35 -3.9% 30.4 % 181.8 187.2 29 7/25 76.44 -23.6% 55.78 -24.6% 20.66 -20.7% 27.0 % 3.7 147.7 28 7/18 91.34 -5.5% 63.42 -9.0% 27.93 3.6% 30.6 % 184.7 134.7 27 7/11 75.36 -5.9% 58.00 -4.7% 17.36 -9.7% 23.0 % 34.9 14.6 Q2 HMM 1136.2 -17.9% 789.33 -18.0% 346.83 -17.5% 30.5% 1763.1 1836.5 26 7/4 80.04 -10.1% 59.99 -9.6% 20.05 -11.6% 25.0 % 115.1 4.7 25 6/27 76.22 -21.3% 56.18 -16.9% 20.04 -31.5% 26.3 % 0.1 121.6 24 6/20 96.47 -18.9% 64.82 -15.8% 31.65 -24.5% 32.8 % 100.5 317.6 23 6/13 90.01 -21.9% 61.54 -19.8% 28.47 -26.0% 31.6 % 185.5 145.4 22 6/6 97.72 -12.0% 65.23 -11.7% 32.49 -12.6% 33.2 % 308.9 243.4 21 5/30 83.37 0.7% 58.42 -3.7% 24.95 12.7% 29.9 % 23.6 23.6 20 5/23 105.56 18.2% 67.81 6.1% 37.74 48.8% 35.8 % 375.9 189.1 19 5/16 86.81 2.2% 60.42 -2.7% 26.39 15.3% 30.4 % 34.3 72.1 18 5/9 100.88 10.2% 66.77 -0.7% 34.11 40.2% 33.8 % 251.6 5.7 17 5/2 79.35 -10.8% 57.24 -12.2% 22.11 -6.8% 27.9 % 225.1 51.6 16 4/25 80.42 -10.4% 57.62 -11.9% 22.80 -6.5% 28.4 % 91.6 0.1 15 4/18 76.44 -56.7% 54.38 -55.8% 22.06 -58.7% 28.9 % 43.1 296.7 14 4/11 82.89 -44.1% 58.91 -37.0% 23.97 -56.2% 28.9 % 7.8 365.0 Q1 HMM 1578.06 -12.1% 1064.33 -11.9% 513.76 -12.4% 32.6% 3178.4 3176.1 13 4/4 150.33 10.2% 99.28 9.4% 51.05 11.8% 34.0 % 332.0 165.9 12 3/28 145.19 -3.0% 90.83 -9.0% 54.36 9.1% 37.4 % 498.8 187.9 11 3/21 112.10 -53.7% 76.52 -45.3% 35.58 -65.1% 31.7 % 260.4 643.5 10 3/14 119.66 -11.6% 81.16 -13.1% 38.50 -8.3% 32.2 % 113.4 66.6 9 3/7 139.83 -1.7% 91.54 -14.1% 48.29 -18.6% 34.5 % 350.9 490.2 8 2/28 151.40 -2.6% 95.11 -3.3% 56.32 -1.4% 37.2 % 303.3 506.5 7 2/21 120.65 -5.2% 82.04 -7.6% 38.61 0.3% 32.0 % 216.5 0.2 6 2/14 129.22 -17.1% 91.16 -18.0% 38.06 -12.9% 29.5 % 126.3 162.8 5 2/7 120.93 3.2% 84.14 -0.7% 36.79 13.4% 30.4 % 184.4 147.1 4 1/31 110.66 0.4% 75.00 -3.0% 35.67 8.3% 32.2 % 192.8 319.5 3 1/24 100.24 4.2% 68.82 -1.4% 31.43 18.8% 31.4 % 273.7 196.0 2 1/17 89.84 -15.3% 65.07 -14.6% 24.76 -17.2% 27.6 % 201.2 261.7 1 1/10 87.99 -10.9% 63.66 -11.4% 24.34 -9.5% 27.7 % 124.8 28.2 2014 HMM 6783.24 -10.1% 4661.69 -11.0% 2121.58 -7.9% 31.3% 10450.6 10589.2 Q4 HMM 2267.71 -14.1% 1540.94 -13.0% 726.79 -16.4% 32.0% 3157.4 3445.0 52 1/3 121.21 -4.4% 83.90 -6.1% 37.31 -0.5% 30.8 % 103.7 24.5 51 12/27 263.04 -3.6% 182.27 -3.0% 80.77 -4.8% 30.7 % 7.1 83.9 50 12/20 306.48 -20.8% 206.91 -21.0% 99.57 -20.5% 32.5 % 343.4 406.9 49 12/13 248.11 -24.8% 161.33 -20.5% 86.78 -31.7% 35.0 % 409.4 618.1 48 12/6 203.22 -11.9% 139.51 -8.0% 63.71 -19.3% 31.4 % 291.0 235.1 47 11/29 329.76 -11.5% 226.35 -10.7% 103.42 -13.4% 31.4 % 165.5 80.0 46 11/22 128.77 -17.6% 90.97 -14.0% 37.81 -25.2% 29.4 % 324.7 354.1 45 11/15 138.26 -8.0% 90.36 -4.8% 47.90 -13.5% 34.6 % 391.5 380.3 44 11/8 128.78 2.9% 83.10 -5.6% 45.68 22.9% 35.5 % 408.5 209.3 43 11/1 88.60 -31.4% 66.32 -24.2% 22.28 -46.6% 25.1 % 65.1 302.2 42 10/25 93.20 -14.2% 66.38 -15.6% 26.82 -10.5% 28.8 % 157.1 212.5 41 10/18 112.00 -14.9% 72.69 -17.5% 39.31 -9.5% 35.1 % 347.4 293.7 40 10/11 106.28 -10.8% 70.85 -12.9% 35.43 -6.1% 33.3 % 182.9 244.6 Q3 HMM 1320.38 -8.6% 935.73 -8.5% 384.66 -9.1% 29.1% 2295.1 2305.5 39 10/4 113.89 -18.5% 73.80 -12.6% 40.09 -27.5% 35.2 % 278.5 288.6 38 9/27 97.15 -22.7% 69.79 -11.9% 27.37 -41.1% 28.2 % 155.7 414.8 37 9/20 120.20 5.5% 80.61 2.8% 39.59 11.5% 32.9 % 391.2 213.6 36 9/13 111.46 -16.0% 73.15 -14.5% 38.31 -18.7% 34.4 % 285.5 239.8 35 9/6 88.74 -18.9% 68.01 -17.8% 20.73 -22.1% 23.4 % 40.0 123.9 34 8/30 97.67 -16.3% 71.81 -15.8% 25.85 -17.5% 26.5 % 67.6 197.5 33 8/23 103.27 0.9% 70.74 -7.8% 32.53 27.1% 31.5 % 217.1 146.6 32 8/16 99.46 -2.2% 72.02 -4.6% 27.44 4.9% 27.6 % 93.1 130.3 31 8/9 111.46 4.8% 78.38 4.2% 33.08 6.2% 29.7 % 283.2 136.9 30 8/2 100.58 -3.3% 73.19 -2.7% 27.40 -4.7% 27.2 % 187.2 125.4 29 7/26 99.91 8.7% 73.88 3.1% 26.03 28.5% 26.1 % 147.6 3.9 28 7/19 96.55 -5.0% 69.59 -8.5% 26.96 5.5% 27.9 % 133.9 159.9 27 7/12 80.04 -19.4% 60.76 -20.2% 19.28 -16.8% 24.1 % 14.6 124.3 Q2 HMM 1381.45 -1.7% 961.09 -5.7% 420.37 8.6% 30.4% 1833.8 1735.1 26 7/5 88.88 -11.2% 66.22 -15.0% 22.66 2.3% 25.5 % 4.6 1.1 25 6/28 96.64 -0.7% 67.38 -8.4% 29.26 23.1% 30.3 % 121.6 78.1 24 6/21 118.84 8.1% 76.92 -2.9% 41.93 36.6% 35.3 % 316.3 135.0 23 6/14 115.15 -21.0% 76.72 -21.8% 38.43 -19.4% 33.4 % 144.9 334.5 22 6/7 110.91 -9.8% 73.74 -15.1% 37.17 3.0% 33.5 % 243.4 325.5 21 5/31 82.78 -10.1% 60.65 -12.9% 22.12 -1.4% 26.7 % 23.6 18.4 20 5/24 89.23 -13.7% 63.85 -15.3% 25.38 -9.3% 28.4 % 189.1 84.8 19 5/17 84.90 -11.9% 62.00 -12.3% 22.89 -10.9% 27.0 % 72.1 61.8 18 5/10 91.35 -22.5% 67.02 -19.8% 24.33 -29.0% 26.6 % 5.7 223.5 17 5/3 88.49 -15.2% 64.85 -14.1% 23.65 -18.2% 26.7 % 51.6 189.7 16 4/26 89.68 -11.1% 65.32 -10.6% 24.37 -12.3% 27.2 % 0.1 113.5 15 4/19 176.28 56.2% 122.89 54.5% 53.39 60.3% 30.3 % 295.8 162.8 14 4/12 148.32 45.2% 93.53 23.4% 54.79 108.0% 36.9 % 365.0 6.4 Q1 HMM 1813.70 -11.6% 1223.93 -14.2% 589.76 -5.7% 32.5% 3164.4 3103.6 13 4/5 136.35 6.0% 90.67 -1.5% 45.68 24.8% 33.5 % 165.9 0.4 12 3/29 149.53 -32.9% 99.72 -35.3% 49.81 -27.6% 33.3 % 187.8 297.1 11 3/22 241.91 18.3% 139.92 11.3% 101.98 29.5% 42.2 % 641.1 618.9 10 3/15 145.68 -10.9% 101.76 -8.6% 43.92 -15.8% 30.1 % 66.6 247.4 9 3/8 165.48 -15.3% 106.21 -20.7% 59.26 -3.4% 35.8 % 488.3 257.6 8 3/1 155.39 -12.4% 98.31 -23.9% 57.09 18.3% 36.7 % 503.8 315.7 7 2/22 127.22 -19.7% 88.74 -16.0% 38.47 -27.0% 30.2 % 0.2 247.3 6 2/15 155.64 -20.7% 111.97 -15.2% 43.67 -31.9% 28.1 % 162.8 368.9 5 2/8 117.08 -18.4% 84.67 -18.6% 32.41 -17.9% 27.7 % 144.0 171.1 4 2/1 118.53 -4.5% 84.08 -5.7% 34.46 -1.4% 29.1% 318.9 221.4 3 1/25 96.17 -7.9% 69.76 -11.4% 26.41 2.7% 27.5% 195.3 47.0 2 1/18 106.11 -10.2% 76.19 -11.5% 29.92 -6.8% 28.2% 261.6 213.6 1 1/11 98.61 -14.2% 71.93 -15.1% 26.68 -11.8% 27.1% 28.2 97.3 2013 HMM 7539.31 -8.3% 5242.51 -13.1% 2296.82 4.9% 30.5% 10668.2 10071.3 Q4 HMM 2766.93 -9.8% 1851.78 -14.0% 915.15 0.1% 33.1% 3728.2 3249.2 53 1/4 126.71 -11.6% 89.22 -14.9% 37.49 -2.5% 29.6% 24.5 67.2 52 12/28 272.62 14.2% 187.84 9.7% 84.77 25.6% 31.1% 83.8 11.9 51 12/21 386.85 -8.2% 261.74 -14.4% 125.11 8.2% 32.3% 406.8 284.4 50 12/14 330.14 -5.5% 203.04 -15.2% 127.10 15.7% 38.5% 617.5 493.4 49 12/7 230.30 -24.6% 151.36 -22.3% 78.94 -28.7% 34.3% 235.1 586.2 48 11/30 372.25 70.3% 253.10 64.6% 119.15 83.8% 32.0% 79.9 133.4 47 11/23 156.10 -60.0% 105.57 -62.3% 50.53 -54.0% 32.4% 354.0 85.0 46 11/16 149.93 -12.3% 94.62 -18.5% 55.31 0.9% 36.9% 376.1 326.6 45 11/9 124.86 -3.7% 87.74 -6.2% 37.12 2.7% 29.7% 209.3 315.0 44 11/2 128.93 2.0% 87.22 -9.4% 41.72 38.1% 32.4% 301.9 93.5 43 10/26 108.04 -27.3% 78.18 -28.3% 29.87 -24.6% 27.6% 212.5 227.0 42 10/19 131.05 -5.6% 87.75 -11.0% 43.30 7.7% 33.0% 293.5 350.8 41 10/12 119.64 -13.2% 81.55 -11.3% 38.09 -16.9% 31.8% 244.6 181.9 40 10/5 129.51 -12.4% 82.85 -14.9% 46.65 -7.6% 36.0% 288.6 93.1 Q3 DEG 1448.64 -13.4% 1011.45 -15.4% 437.19 -8.3% 30.2% (EST)273.9 15.9%(share) Q3 HMM 1401.22 -14.3% 1010.62 -16.4% 390.58 -8.4% 27.9% 2017.4 2145.2 39 9/28 125.64 -37.1% 79.05 -29.2% 46.59 -47.1% 37.1% 414.8 624.7 38 9/21 113.74 -4.1% 78.15 -13.1% 35.58 24.2% 31.3% 213.5 116.7 37 9/14 132.99 -1.9% 85.34 -15.8% 47.65 39.1% 35.8% 239.8 211.1 36 9/7 108.70 8.9% 80.72 -13.8% 27.98 8.9% 25.7% 123.8 46.5 35 8/31 114.52 -21.0% 84.31 -21.6% 30.21 -19.3% 26.4% 197.5 262.5 34 8/24 102.07 -29.3% 76.50 -28.1% 25.57 -32.7% 25.1% 146.4 105.5 33 8/17 101.24 -31.8% 75.14 -30.9% 26.10 -34.2% 25.8% 130.3 412.4 32 8/10 106.13 -8.3% 75.01 -13.4% 31.12 7.0% 29.3% 136.9 216.2 31 8/3 103.89 10.4% 75.15 -1.7% 28.74 62.5% 27.7% 125.4 0.1 30 7/27 91.47 -3.5% 71.25 -4.9% 20.21 1.8% 22.1% 3.9 18.5 29 7/20 101.61 -3.4% 76.01 -7.2% 25.60 9.8% 25.2% 159.9 81.0 28 7/13 99.26 -5.7% 76.13 -8.7% 23.13 6.0% 23.3% 124.3 59.6 27 7/6 99.96 -8.0% 77.86 -9.5% 22.10 -2.4% 22.1% 1.1 0.5 Q2 DEG 1457.26 -13.0% 1052.97 -16.7% 404.29 -1.5% 27.7% (EST)259.4 15.1%(share) Q2 HMM 1432.97 -13.2% 1031.66 -17.1% 401.32 -1.3% 28.0% 1777.3 2318.0 26 6/29 97.21 -21.8% 73.46 -20.8% 23.76 -24.7% 24.4% 78.1 350.5 25 6/22 109.92 -5.8% 79.23 -10.9% 30.69 10.7% 27.9% 135.0 98.6 24 6/15 145.76 -10.6% 98.08 -15.6% 47.68 1.9% 32.7% 334.2 275.5 23 6/8 122.79 -19.0% 86.72 -18.2% 36.06 -21.0% 29.4% 325.2 374.1 22 6/1 91.91 -18.9% 69.55 -20.2% 22.36 -14.4% 24.3% 18.4 37.0 21 5/25 103.15 -6.7% 75.17 -10.1% 27.98 3.8% 27.1% 84.8 178.2 20 5/18 96.09 -12.1% 70.43 -15.0% 25.67 -3.1% 26.7% 61.8 200.1 19 5/11 117.72 -5.1% 83.48 -11.5% 34.24 15.4% 29.1% 223.5 187.5 18 5/4 104.34 -4.3% 75.45 -12.1% 28.89 24.7% 27.7% 189.5 105.0 17 4/27 100.75 -4.2% 72.97 -8.6% 27.78 9.8% 27.6% 157.3 67.9 16 4/20 112.75 1.5% 79.45 -3.3% 33.30 14.9% 29.5% 162.8 236.0 15 4/13 102.06 -6.0% 75.74 -12.1% 26.32 17.6% 25.8% 6.4 51.8 14 4/6 128.52 -36.9% 91.93 -41.8% 36.59 -20.0% 28.5% 0.4 155.8 Q1 DEG 2098.83 2.1% 1455.55 -6.7% 643.28 28.5% 30.6% (EST)231.2 9.9%(share) Q1 HMM 2064.90 2.5% 1437.67 -6.2% 627.26 30.1% 30.4% 3169.8 2426.1 13 3/30 222.64 41.9% 153.75 26.4% 68.89 95.1% 30.9% 294.8 171.2 12 3/23 204.22 35.8% 125.59 14.6% 78.63 92.8% 38.5% 618.7 356.9 11 3/16 163.59 10.3% 111.45 -1.8% 52.15 49.6% 31.9% 244.8 279.2 10 3/9 195.09 19.0% 133.76 10.1% 61.33 44.3% 31.4% 256.6 216.0 9 3/2 177.32 15.9% 129.10 10.1% 48.23 35.0% 27.2% 315.6 82.3 8 2/23 158.25 -1.7% 105.48 -14.7% 52.77 41.6% 33.3% 251.0 274.4 7 2/16 196.00 -6.2% 131.73 -18.6% 64.27 36.6% 32.8% 368.6 16.2 6 2/9 143.36 -30.4% 103.88 -31.5% 39.48 -27.5% 27.5% 171.1 321.4 5 2/2 124.02 -15.3% 89.11 -19.9% 34.91 -0.8% 28.1% 221.2 118.7 4 1/26 104.36 -19.8% 78.68 -18.6% 25.69 -23.2% 24.6% 46.5 226.0 3 1/19 118.15 -7.3% 88.02 -14.7% 32.13 20.7% 27.2% 213.2 114.0 2 1/12 114.83 -8.9% 84.56 -13.8% 30.27 8.1% 26.4% 96.8 116.2 1 1/5 143.07 5.5% 104.56 -0.1% 38.51 24.4% 26.9% 67.2 134.3
Last edited by bruceames; 06-26-19 at 08:34 AM.
06-26-19, 01:12 AM
#5497
Re: Blu-ray and DVD sales - We're number 2, but we try harder
What is TBO?
And I’m surprised overall disc sales on the 15th wasn’t boosted by Captain Marvel. Seems like no one bought the DVD.
And I’m surprised overall disc sales on the 15th wasn’t boosted by Captain Marvel. Seems like no one bought the DVD.
Last edited by WeeBey; 06-26-19 at 01:23 AM.
06-26-19, 08:38 AM
#5498
DVD Talk Special Edition
 07-04-19, 12:12 PM
#5500
Re: Blu-ray and DVD sales - We're number 2, but we try harder
Random interesting stat I just saw for the UK:
In 2012, 83% of households had a DVD player. In 2018 it was down to 56%. BD players are in 25% of households.
For the USA:
- 38% of 18-29 year olds own a BD or DVD player
- 53% of 30-49 year olds own a BD or DVD player
- 51% of 50-64 year olds own a BD or DVD player
In 2012, 83% of households had a DVD player. In 2018 it was down to 56%. BD players are in 25% of households.
For the USA:
- 38% of 18-29 year olds own a BD or DVD player
- 53% of 30-49 year olds own a BD or DVD player
- 51% of 50-64 year olds own a BD or DVD player